PIT Point In Time
Introduction
We often have descriptive data in our Power BI models. Data may vary over time and have validity dates. It can become a real headache when creating a data model.
What kind of data ?
- A car could change his production plant through time.
- A car can have different engines over time.
- A customer can have through time:
- One or more loyalty cards
- One or more addresses
What data types ?
- Multiple data
- With a notion of time. (The information is valid from one date to another and potentially followed or overlapped by another)
PIT - Point In Time - Datavault
Point In Time is a concept widely used when creating a data warehouse in a Datavault flavor. Performing a snapshot and historizing the data makes restitution much easier. (I will not discuss the pros or cons of Datavault, but I have my preferences ^^) If you want to know more, I invite you to read this article. (Written by Dan Linstedt)
What do we expect?
It is exciting for our users to navigate through the data by applying a time filter (CFR Slicer Date) How: By creating a DAX measure. (#PIT Shoes)
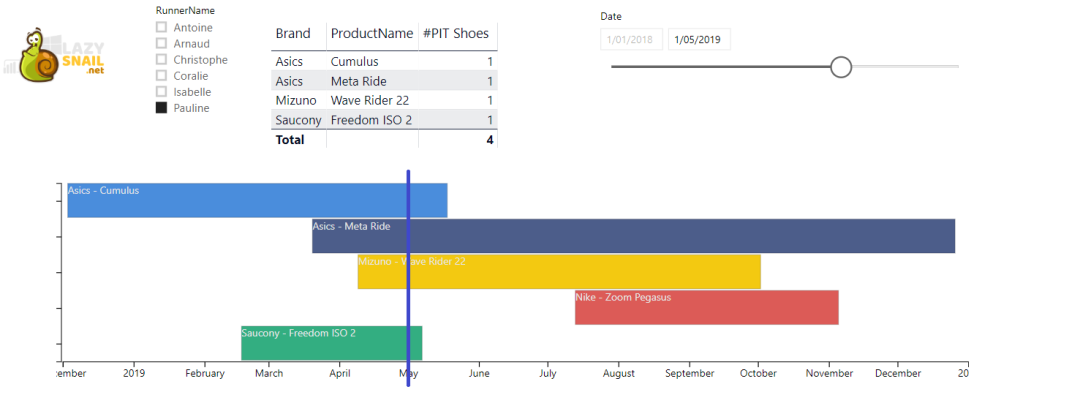
The following example shows dynamically Pauline’s shoes over the time. 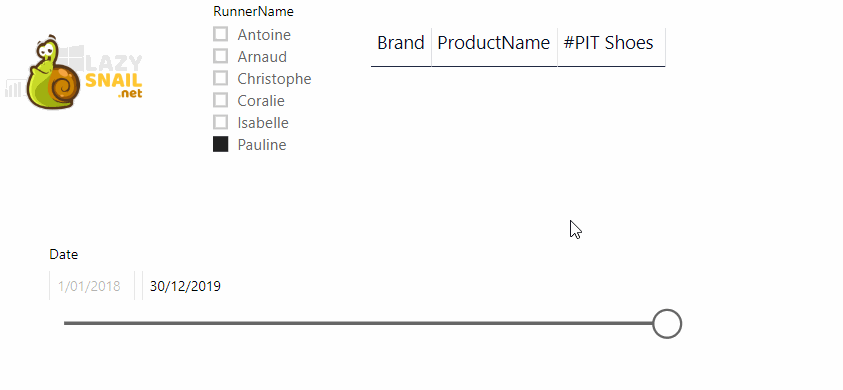
DataModel
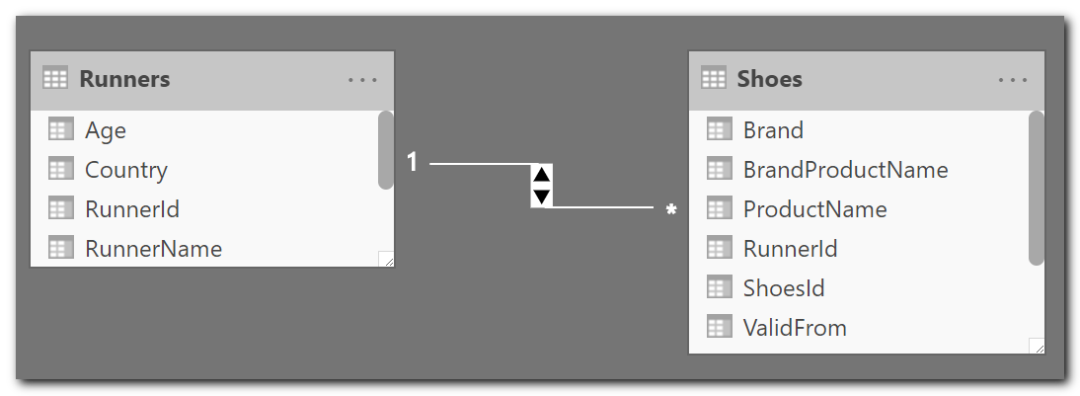
Our data model
The following example is quite simple (The Power BI file is available for download at the end of this article) Many of you know it, I am passionate about Power BI, running, but many ignore my “passion” with running shoes. (Nobody is perfect !) The example refers to a list of runners who have one or more pairs of shoes over time.
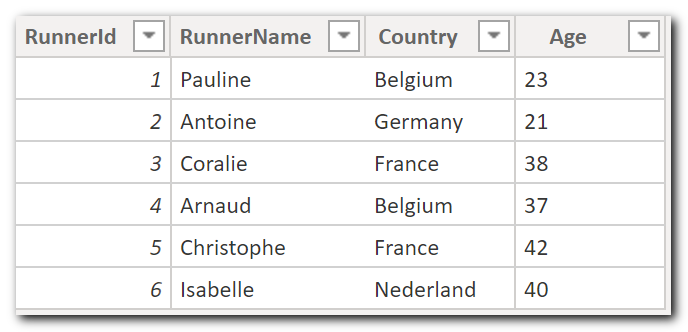
The Runners table:
The Shoes table
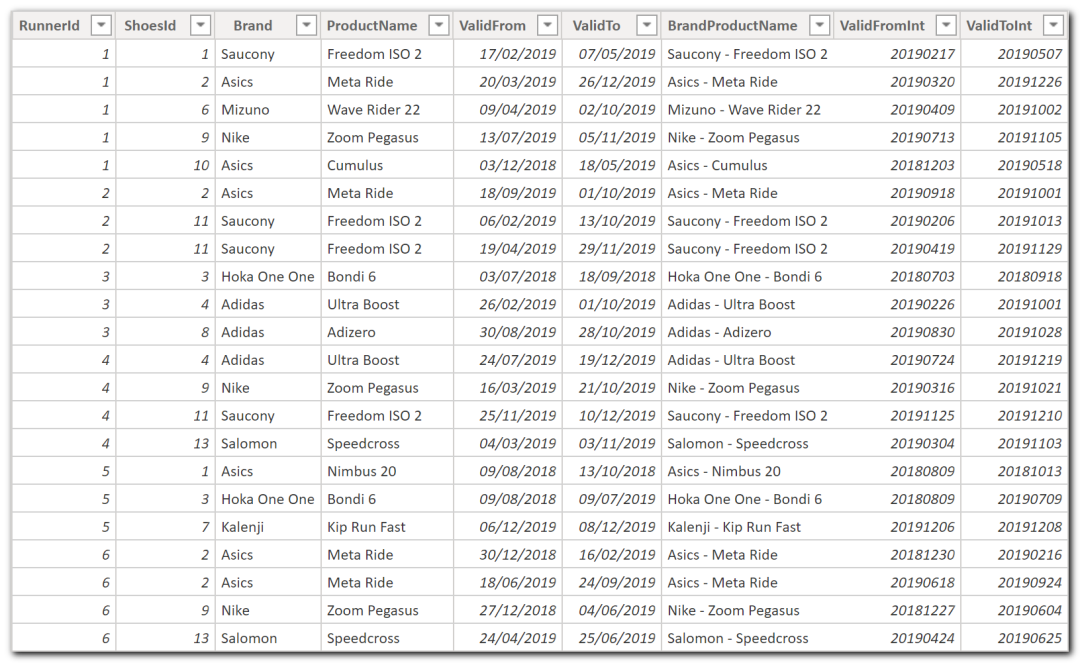
Model specificities
- RunnerId (The Runner Table Key) is available for all shoes.
- For performance reasons, the date stamps are duplicated and converted into numeric.
- ValidFrom - ValidFromInt
- ValidTo - ValidToInt
More information
This is denormalization of a star schema generally composed of a Bridge and a dimension table. In a Datawarehouse (Kimball), we should have a Bridge:
BridgeRunnerShoesand a dimension:DimShoesWhy
It helps our users to have better comprehension. (Simplicity)
The Vertipaq engine will compress the redundant information
To avoids an extrajoin / relationship . You want to know more about Bridges: https://www.kimballgroup.com/data-warehouse-business-intelligence-resources/kimball-techniques/dimensional-modeling-techniques/multivalued-dimension-bridge-table/
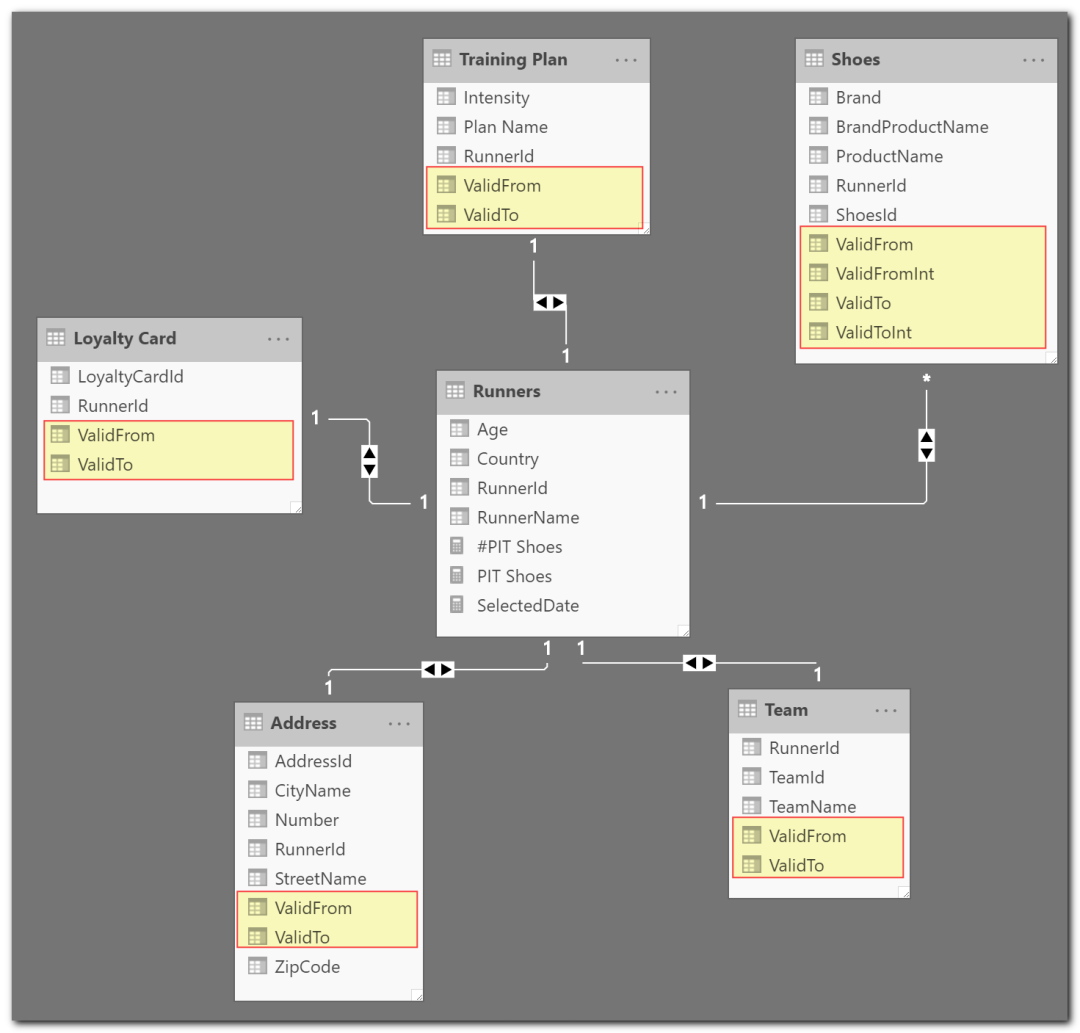
A more complete model could look like this one
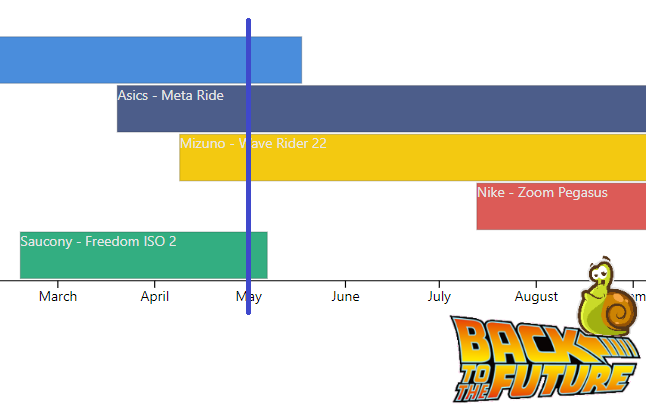
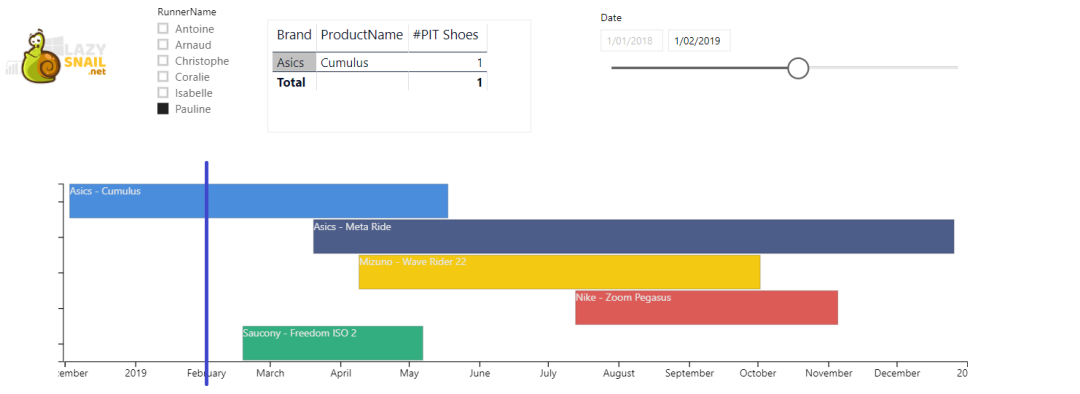
TimeLine
Graphically analyze the different interactions.
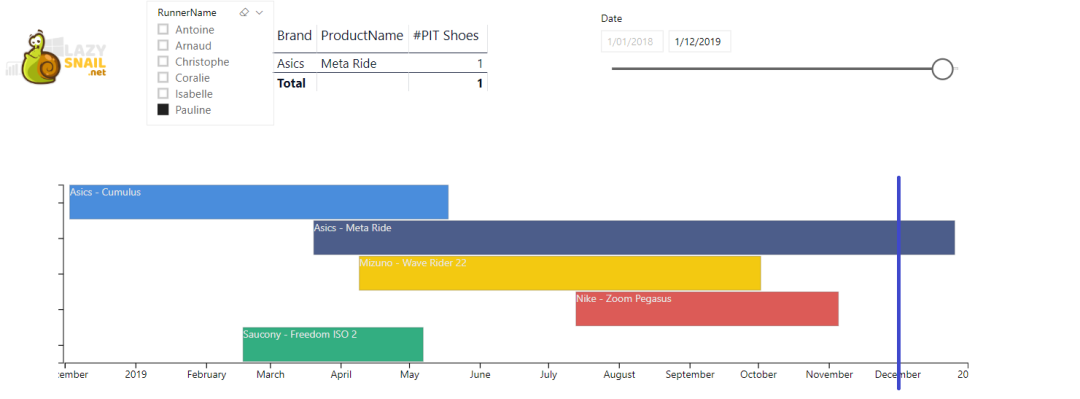
- Our user pick a date via the PIT Date slicer
- The shoe table changes dynamically and
display the one owned on that date.
NB The blue bar drawn on the timeline has been added manually in MS Paint. (If you know a visual component that can display it, do not hesitate to contact me)
Filter: 01/02/2019 | Pauline
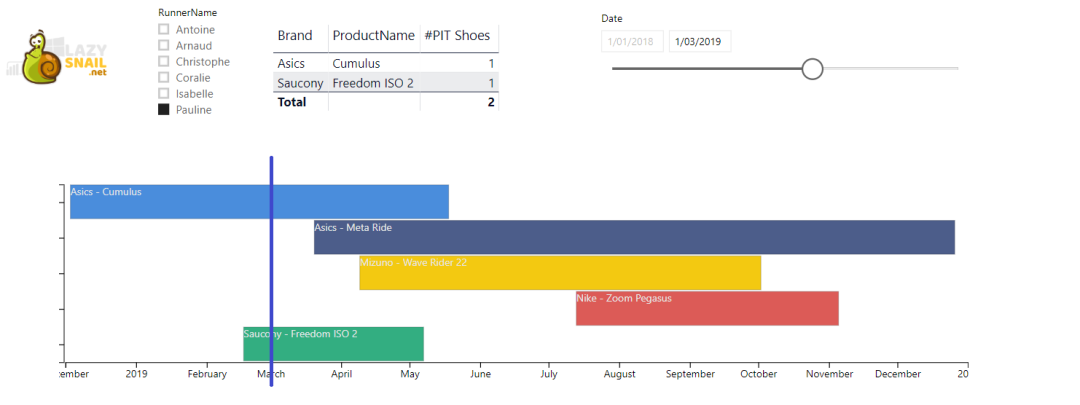
Filter: 01/03/2019 | Pauline
Filter: 01/05/2019 | Pauline
Filter: 10/10/2019 | Pauline

Filter: 01/12/2019 | Pauline
Implementation
Create a Calendar table
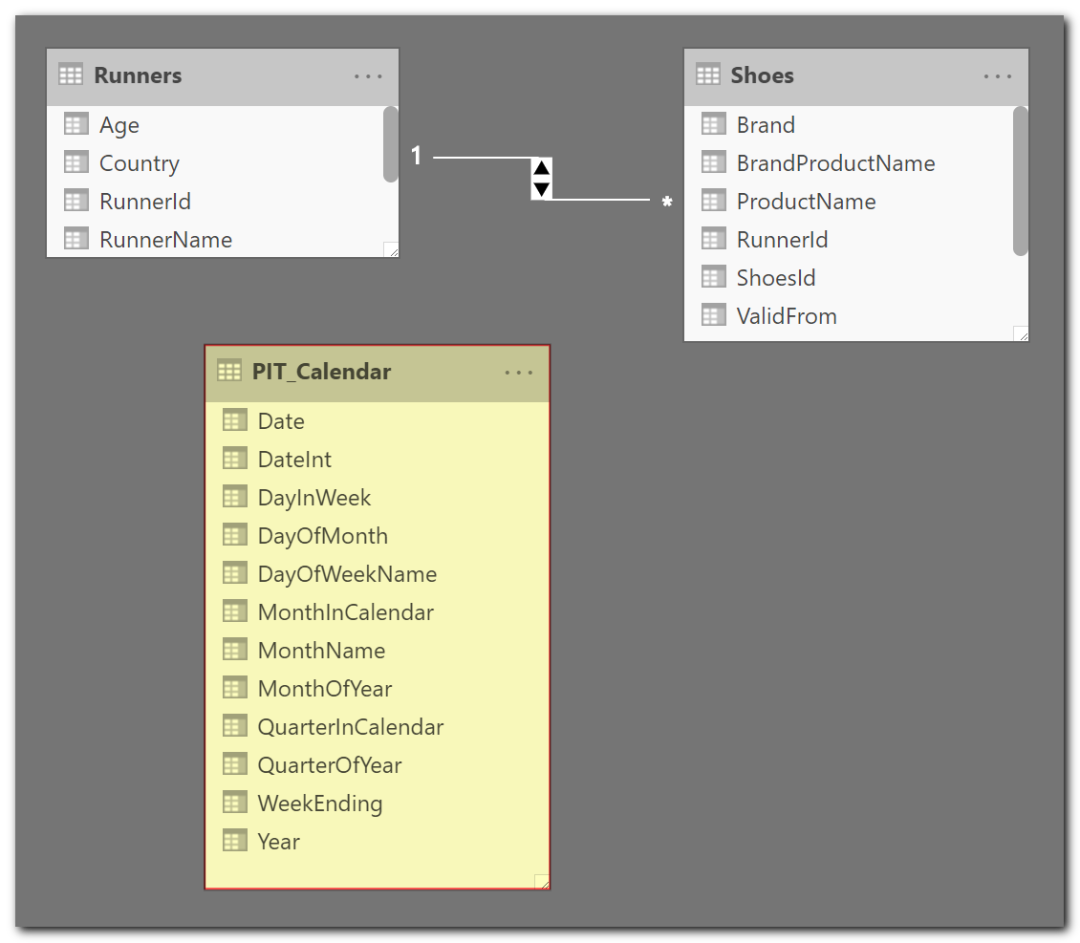
We have to create a Date table, which will not be associated with our model. (Called here PIT Calendar) To quickly create a Calendar table, I suggest you write an M Query in the Query Builder. The following articles will give you the approach. https://blog.crossjoin.co.uk/2013/11/19/generating-a-date-dimension-table-in-power-query/ https://www.mattmasson.com/2014/02/creating-a-date-dimension-with-a-power-query-script/
Create a DAX Measure
This measure Filter the Shoes table by the selected date.
#PIT Shoes =
  VAR CurrentDateInt = MAX(PIT_Calendar[DateInt])
  RETURN
  CALCULATE
  (
    DISTINCTCOUNT(Shoes[ShoesId]);
    FILTER(
      'Shoes';
      Shoes[ValidFromInt] <= CurrentDateInt && Shoes[ValidToInt]>= CurrentDateInt
    )
    ; 'Runners'
  )
Understand this DAX expression
VAR CurrentDateInt =
  IF(
    ISCROSSFILTERED(PIT_Calendar)
    ;MAX(PIT_Calendar[DateInt])
    ;VALUE(YEAR(TODAY())*10000 + MONTH(TODAY())*100 + DAY(TODAY()))
  )
Why?
- The user wants to have the situation of the day (without having to modify the PIT slicer at each opening of the report)
- The user forgot to create his report with the PIT slicer. Rather than propose the situation in the future, we apply the current one.
FILTER(
  'Shoes';
  Shoes[ValidFromInt] <= CurrentDateInt && Shoes[ValidToInt] >= CurrentDateInt
)
Conclusion
Now, you know how to make your data alive. Feel free to comment if you have more ideas, improvements, tips, or comments. Download the Power BI example file here
Edit 02/12/2021: If you want to know more or enjoy another point of view Reza Rad did a nice article on this topic too: Power BI From and To Date Filtering with One Slicer - RADACAD